So you think you can program. You believe that you can write code. Well the sad story is that many people can write code. That’s the easy part. Writing good code is difficult. Writing bug free code is nearly impossible on the first try. Any complex application is always going to have bugs. Being able to effectively trace, isolate and fix those bugs is what separates the men from the boys.
Historically it has always been difficult to debug web applications. There has also been a great lack of tools to observe code execution and monitor web applications in the past. In the past we had to resort to hacking and work around. Writing trace values within the code to get feedback so that you can narrow down which line or group of lines that could possibly be the source of your problems.
This complexity in debugging was taken to a whole new level when deploying web applications. It was extremely difficult to track down obscure bugs that only occurred during certain situations and often on particular machines with certain setups and browsers.
With Visual Studio 2008, Visual Web Developer 2008 express edition, it becomes super easy to debug and monitor web applications. In fact the Web Developer debugger works identically to typical window forms debugger. So you will find a certain similarity in debugging web applications to debugging windows forms applications.
You can set different break points, view variable values, step in and out of code, change line execution and even change variables and object values within the debugging session. With the debugger you have various windows to help you in your debugging quest. Things like the local variable window and the watch window all aid in finding that elusive bug.
Also asp.net 2.0 and above includes a tracing tool that will help you to monitor the performance of your web app a snap. You will be able to find out what is lagging in your app performance and why.
In this lesson we are going to look at debugging, setting break points, stepping into code, changing values. In part II we will be looking at the asp.net tracing tool, and finally how to set a custom error page which can be used to give the user a much friendlier error page when something drastically goes wrong.
Let’s begin.
Create a new website. I named mine “Debug and trace” but you can name yours whatever you like. After the default page appears go to the design view and drop three controls onto the page. We are going to drop a Textbox, a button and a Label. Arrange the control to suite your satisfaction.
For the sake of this demonstration we are just going to write some really simple code. Double click on the button to get to the code behind and the button onclick event. we are going to write some code, it really does not matter what it does. We are going to type in something real simple. So type the following in:
string someString;
someString = TextBox1.Text;
Label1.Text = someString;
All this does is declare a variable of type string, put the value of the text entered into the textbox and finally change the text of the label to the value of the string variable which infact is the text of the textbox.
Save and run to test. You will see it perform as expected. Close your browser.
Ok, so it works, not rocket science. Go back to the code behind file. What we are going to do now is set a breakpoint in the click event of the button. To do this place the cursor on the line you want to stop execution, we will do this on the line that has “someString = TextBox1.Text;”. Hit the F9 key. You will notice that the line has a red highlight and that in the left grey colum there is a red circle, depicting a new breakpoint. To disable the breakpoint simplly put your cursor on the breakpoint and hit the F9 key again.
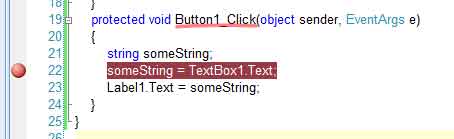
Another way of setting a breakpoint is to put your mouse cursor in the grey column area adjacent to the line you want to set the breakpoint and click. To disable click the red circle in the grey column again.
Set the breakpoint and to start debugging press the F function key or click the green arrow in the toolbar to start the debugging session. Your browser will come up. Type something in the textbox and then click the button.
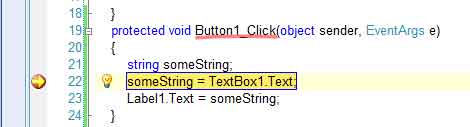
You will be taken to the debugging environment where execution s stopped at your specified breakpoint. This time the line is highlighted in yellow, with an additional yellow arrow, indicating the current line execution, in the red circle, in the left column.
From this point you have a wealth of information about this particular line and even other information preceding this line. As well as more information as you step into the program.
If you hover you cursor over the Text property of the Textbox you will notice an information pop-up window, which will display the value of that property.
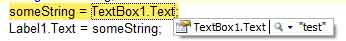
Hovering over the actual control brings up the same information box, but now you have a little plus button to the left.
�
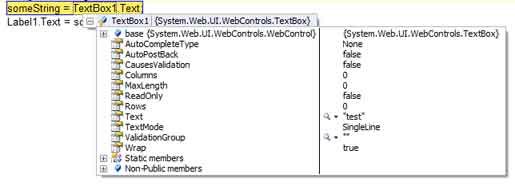
Clicking the plus button to expand and drill down will reveal more properties and values, which you can inspect. When you find another plus button you can click it to drill down further.
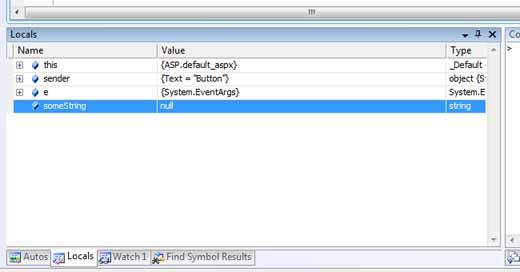
At the bottom of your screen you will also notice a few other windows and tabs. Things like Autos, Local and watch. These are extra tools to help you debug. The autos window will list things like controls, variables and various other aspects of your web form. In the local window you will find the variables and objects related to the local function that you are currently in. In the watch window you can add individual variables and controls. By selecting an empty line you can enter the name of the variable and or control to watch. You can also add to the watch window by highlighting the variable and right clicking, then select “add watch”
To step through the program you can use F11 Function Key to step into. This will step into any function calls that are made from the current line. F10, to step over. This will step over the function call from the current position and continue to the next line in the current method or function. F12, to step out of the current method and go up one level.
You could also use the debug toolbar to achieve the same result.

So to start stepping through the code, hit the F11 function key to step to the next line. Now hover your mouse cursor over the “someString” variable, in the information pop-up, you will notice that the variable now has a value in it, and it’s the value of the textbox text property that you entered. No surprises. Also, look at the local window at the bottom of your screen (or depending on your IDE layout it could be on the side or as a floating window), you will notice the line of your variable, the value in the Value column has just turned red. Indicating that this variable’s value has just changed. Mine changed to “Test”.
You might also notice that you have an Immediate window. If it’s not visible, Click CTRL+ALT+I combination to bring up the immediate window. In here you can type in various C# commands to either change the outcome of a particular variable or property or correct a value on the fly.
In the command window type in the following:
someString = “I changed this in debug mode”
In your locals window, notice now that the value to “someString” have changed to whatever you type into the immediate window. Hover your mouse cursor over the variable in the editor to see that the value has changed. You can also change this value by right clicking the corresponding line in the locals or watch window and select “edit value”.
There are a whole bunch of other tools at your finger tips. Things like the Call Stack window, and the ability to change the breakpoint to a conditional breakpoint. In other words, if you have a long loop, and you want to break when a variable reaches a particular value, you can enter that in the breakpoint, then the app will break when that condition evaluate to true.
There are a lot of other debug helps and techniques that are out of the scope of this lesson. Suffice to say, that debugging web apps are a whole lot simpler and easier now. In fact in VS 2008 you can even debug your java script. Isn’t that the coolest thing. As a side note, VS 2008 even has a set of intellisense for java script.
Back to our web app. If you now click on the green arrow in your debug toolbar, the app will continue to run and you will be able to view the result in your browser.
NOTE: If you are in the debug session for a long time, you might experience a time out when trying to continue. This is as a result of the Cassini (VS debug web server) timing out. Just stop and restart the debug session and continue as before.
Once your browser has come up, you will notice that the label text has changed, not to what you typed in the text box, but to “I changed this in debug mode” or whatever you typed in the immediate window.
Ok so how cool is it to work on a web page, debug a web application or web page in an advanced set of tools that allows you full functionality and control of the Visual studio debugging experience.
For the next part we will be looking at how to set and retrieve trace information and how to set a custom error page.
To be continued ...